

Météogrammes
Météogramme Météos
Les météogrammes météos permettent d’avoir un accès direct aux modèles mathématiques utilisés par toutes les prévisions.
Il y a essentiellement trois modèles qui peuvent être considérés comme indépendants:
- The US’s National Oceanic and Atmospheric Administration runs the Global Forecast System (GFS) which produces a worldwide forecast four times a day for a period of 16 days.
- NOGAPS is a model run by the Naval Research Laboratory in Monterey, CA to be able to keep an eye on GFS accuracy.
- IFS (Integrated Forecast System) is a model operated by the European Centre for Medium-Range Weather Forecasts (ECMWF), that delivers forecasts every twelve hours and for a ten day period.
Seul le NOGAPS a un accès public : météogramme NOAA
Mode d’emplois des météogramme NOAA
- allez sur Google map et récupérez les coordonnées de l’endroit pour lequel vous désirez avoir des prévisions.
Sélectionnez un endroit , clic droit et sélectionnez « What’s there ». Les coordonnées aparaissent dans la barre (45.83 6.86 sur la figure suivante).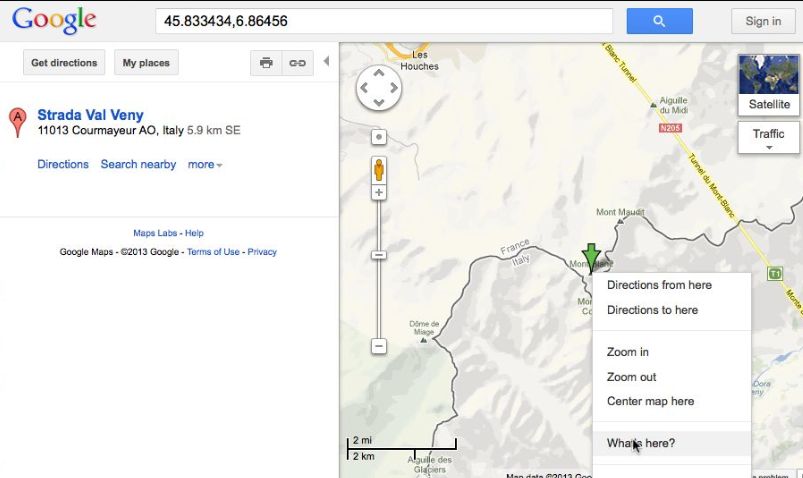 Quelques coordonnées:
- Mont blanc: 45.83 – 6.86
- Chamonix: 45.92 – 6.86
- Freyr: 50.21 – 4.89
- Jalhay: 50.57 – 5.91
- Aiglun: 43.85 – 6.91
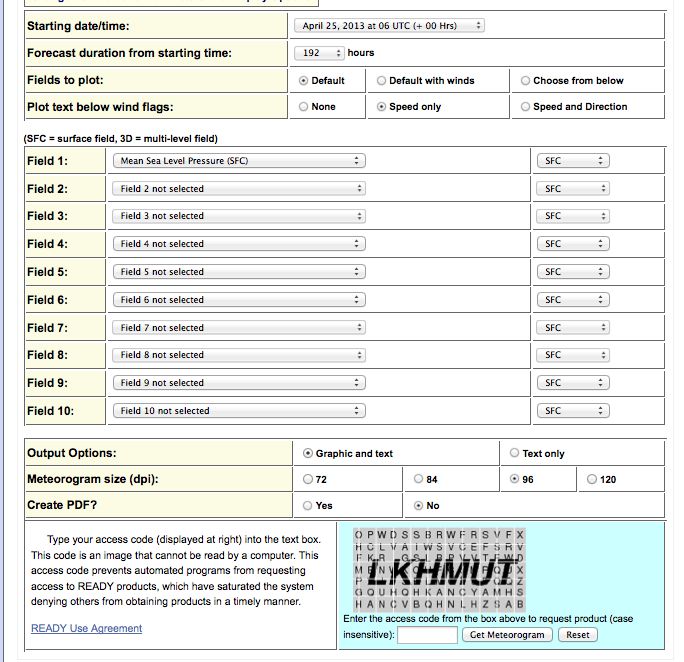
- Allez sur le site de la NOAA: météogramme NOAA
- Rentrer les coordonnées de l’endroit.
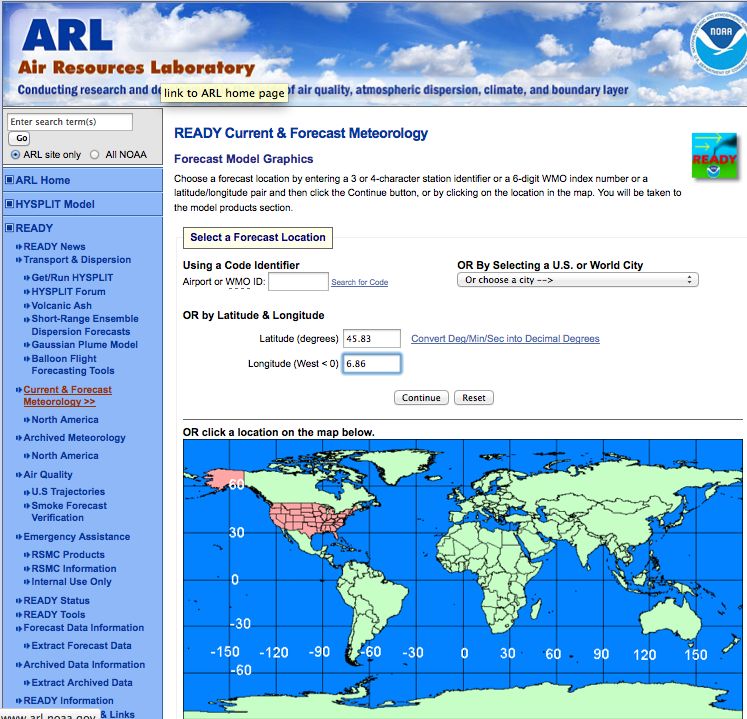
- Cliquez sur « Continue ».
- Choisissez le metogram GFS Model 0-192h:
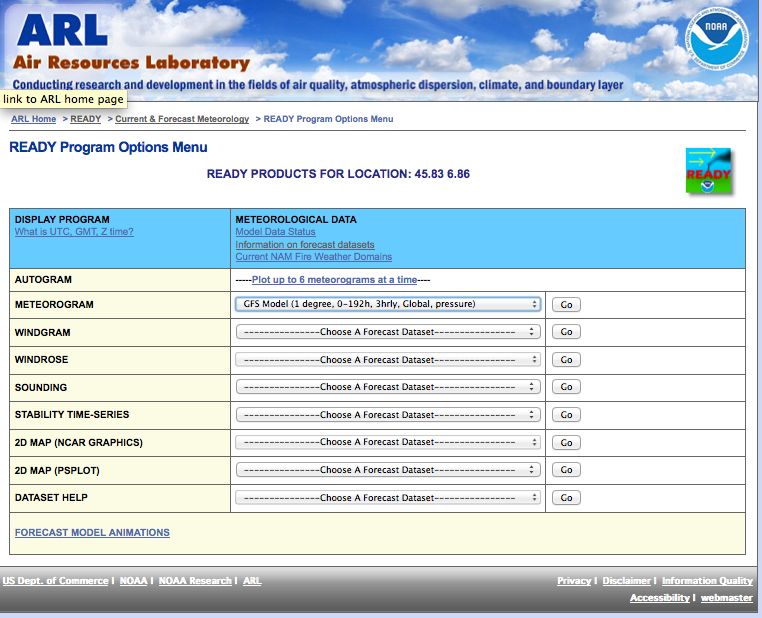
- Appuyez sur GO.
- Appuyez sur Next.
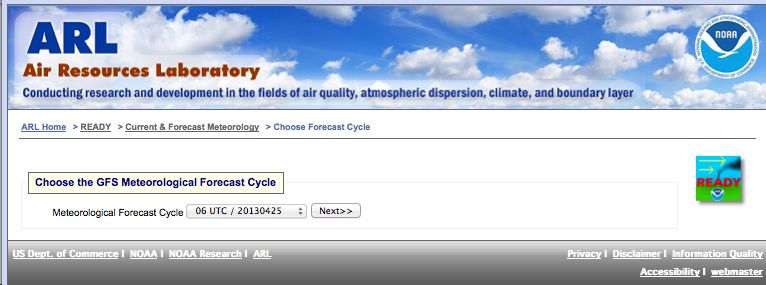
- Sélectionnez Default ou Default with winds.
- Recopiez l’access code et cliquez sur « Get Meteogram »
- Découvrez le Meteogram:
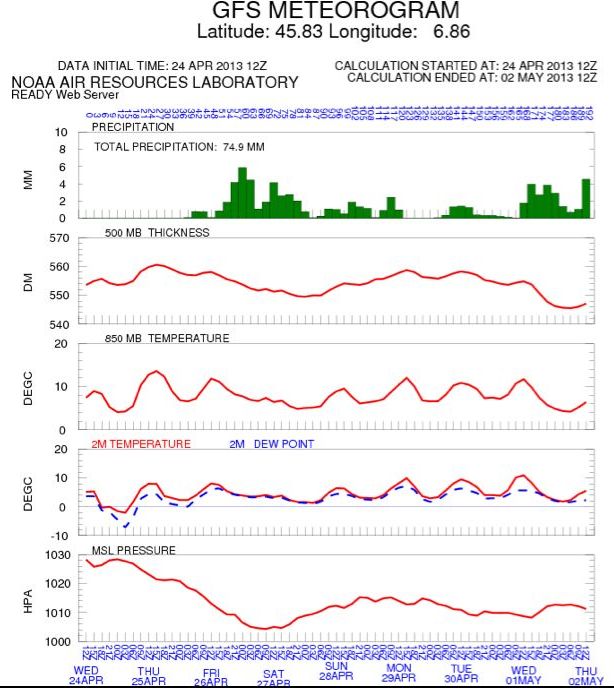
- Les diagrammes Precipitation, Temperature et Pressure sont évidents.
- Precipitation is expressed in millimeters per x hour period in the meteograms, while it is expressed in millimeters for the previous 6 to 12 hour period in the maps.
- Temperature at times is shown not at a defined elevation, but at a certain “barometric pressure height”, expressed in hPa. In those cases refer to this approximately: 1013 hPa=sea level, 800 hPa=1800 meters, 700 hPa=3000 meters, 600 hPa=4000m, 300 hPa=9000 meters. Some meteograms show the temperature at 10m or at 850 hPa height, while others show the 0º isotherm at how it varies in elevation, either in meters or hPA height. The US Navy maps show how the 0º isotherm at 850 hPa moves north to south.
- As far as barometric mean sea level pressure, more often than not good weather happens with mean sea level pressures higher than 1020 hectopascals (hPa). However, good weather can happen with low pressure if the isobars are far from each other. In those cases decent climbing weather can happen with pressure as low as 1000 hPa. One important note, 1 hPA equals 1 millibar (mb or mbar).
- Le diagramme Thickness: The 1000 – 500 thickess is the height difference between the 1000mb level and the 500mb level, measured in decameters (10m). As air expands with heat, a smaller thickness means colder air in between. A practical rule of thumb is that precipitation on the ground is usually as snow if the thickness is smaller tan 540 (loosely, 50% of the time will snow below 300m at thickness=5400m).
- Le diagramme 2MTemperature vs 2M Dew Point montre la température de l’air à 2 mètres du sol en rouge en regard de la température de rosée en bleu Si la courbe de rosée est proche de celle de la température cela signifie qu’il y a beaucoup d’humidité dans l’air (brouillard).
- Le dew point ou point de rosée (ou température de rosée) de l’air est la température à laquelle la pression partielle de vapeur d’eau est égale à sa pression de vapeur saturante. La température de rosé est la température en dessous de laquelle la vapeur d’eau dans un volume d’air humide à une pression constante se condense en liquide à la même vitesse à laquelle il s’évapore. L’eau condensée s’appelle la rosée (dew en anglais) lorsqu’elle se forme sur une surface solide. La température de rosée est associée au taux d’humidité relative. Un taux d’humidité relative élévé indique que la température de rosée est proche de la température de l’air ambiant et donc que l’air est saturé en eau.
- Attention aux zones horaires indiquées en bas qui sont en UTC (+0 h) alors que nous sommes ici en UTC (+1h) en été.
- When looking at wind keep in mind that good weather usually happens with wind from the South or SW, while most storms come from the W or NW. The wind speed is expressed in knots (1kn=1.852 km/h), in kilometers per hour (km/h) or in meters per second (10m/s 36km/h, 15m/s 54km/h, 20m/s 72km/h, 25m/s 90km/h, 30m/s 108km/h). Wind in some cases is expressed at different hPa heights and in others at a fix height. For the latter you will have to know the area to know what 11kn of wind at 10m really feel like in the area you are in, and what wind is climbable wind for your pain tolerance levels. For the “classic” NOAA meteogram that shows wind speed at “10m over sea level” I would suggest that winds over 10 knots are too high to climb if you are on Fitz or Torre. Note that also available from NOAA are windgrams that chart wind speed and direction at different heights for the duration of the forecast model. In the maps the wind is expressed in flags. The flags show the direction of the wind while the tails indicate the intensity, each tail being 10 knots. You can also guess wind from the maps by looking at the distance between the isobars. Wind is at times shown not at a defined elevation, but at a certain “barometric pressure height”, expressed in hPa. In those cases refer to this approximately: 1013 hPa=sea level, 800 hPa=1800 meters, 700 hPa=3000 meters, 600 hPa=4000m, 300 hPa=9000 meters.
